IMPORTANT NOTICE ABOUT COMMENTS

COMMENTS HAVE BEEN DISABLED

Because of spam, I personally moderate all comments left on my blog. However, because of health issues, I will not be able to do so in the future.

If you have a personal question about LI or any related topic you can send me an email at stevecarper@cs.com. I will try to respond.

Otherwise, this blog is now a legacy site, meaning that I am not updating it any longer. The basic information about LI is still sound. However, product information and weblinks may be out of date.

In addition, my old website, Planet Lactose, has been taken down because of the age of the information. Unfortunately, that means links to the site on this blog will no longer work.

For quick offline reference, you can purchase Planet Lactose: The Best of the Blog as an ebook on Amazon.com or BarnesandNoble.com. Almost 100,000 words on LI, allergies, milk products, milk-free products, and the genetics of intolerance, along with large helpings of the weirdness that is the Net.

Showing posts with label nutritional information. Show all posts

Thursday, June 24, 2010

Submit Comments on Dietary Guidelines for Americans

Every five years, the U.S. Department of Health and Human Services must revise its dietary guidelines. These get more controversial each time as more and more special interest groups chime in demanding that the government protect or promote their interests and more and more special interest groups put in their two cents demanding that the government stay out of their business. Somewhere in between are you, who are probably represented by one or more of those groups who you know it - or like it - or not.

But you get a say in the whole process. You can submit comments just like any well-funded outfit with a squadron of lobbyists.

Written comments can be submitted at www.dietaryguidelines.gov or mailed to Carole Davis, Co-Executive Secretary, Dietary Guidelines Advisory Committee, USDA Center for Nutrition Policy and Promotion, Room 1034, Alexandria, VA 22302.

To provide oral testimony at the July 8 public meeting, you must register by going to www.dietaryguidelines.gov or by calling Crystal Tyler at (202) 314-4701 prior to 5 p.m. EDT on June 30. The meeting will be held in the Jefferson Auditorium in the USDA South Building, 14th Street and Independence Avenue, S.W., on July 8 beginning at 9:00 a.m. and ending not later than 5:00 p.m.

Just so you know exactly what you're commenting on, the entire report is available online as a series of pdf's. Go to this page for the report, plus appendices and special supplemental information.

Bookmark and Share

Tuesday, May 11, 2010

AllergyEats.com

I got a great email recently.

As a father of 5 children, 2 of whom with food allergies, I am very aware of the difficulties and anxieties that go along with having to manage food allergies/intolerances on a daily basis. In my experience, dining out has been one of the greatest challenges and sources of frustration.

As a result of this, I decided two years ago to create an easy-to-use online guide to allergy-friendly restaurants for the benefit of our entire community. I am writing you today in an effort to introduce you to this new website, AllergyEats (www.allergyeats.com), with the thought that you might find it a valuable tool to share with your readers.

AllergyEats is a peer-based guide with a database that includes over 600,000 US restaurants. Individuals with food allergies or intolerances can rate any restaurant experience by answering 3 simple questions (adding comments if they like). The process can take under a minute. The answers to these questions are translated into a simple “allergy-friendliness” rating.

Other users can then go to AllergyEats when seeking an allergy-friendly restaurant. By simply typing in the geographic location they’re interested in, users can see a restaurant’s “allergy-friendliness” rating, as well as other useful information where available, such as menus, allergen lists, gluten-free menus, nutrition guides, industry certifications, and more.

AllergyEats is new, having been live for roughly 10 weeks. However, where awareness has blossomed, initial reaction has been fantastic and word-of-mouth has driven many ratings quickly (the Boston metro area achieved over 200 ratings in this short amount of time!). Each additional rating, anywhere in the country, increases the value of AllergyEats as a tool for our entire food allergy community. That is why major food allergy and Celiac organizations have endorsed or become friends of AllergyEats so quickly (please see these tabs on the site)... and there are more to come!

The overall look of the site is great and easy to use. Typing in at least your state and zip code is necessary to narrow down that huge database, but you can search by distance, by restaurant name, and by ten allergens: Peanuts, Dairy, Wheat, Fish, Sesame, Tree Nuts, Eggs, Gluten, Shellfish, and Soy. If you find a restaurant that looks good you can get a Google map and directions.

The problem, of course, is that 99% of local restaurants have not been rated yet. Chains do have very useful links to nutritional information and allergen pages, however.

It's the usual chicken and egg problem. The site would be more helpful if people used it and added ratings, but getting people to use a site with no ratings is a challenge.

That's why Paul emailed me, to get the word out, and I'm glad to help. Go there, rate a few restaurants, and tell your friends.

Bookmark and Share

Monday, May 03, 2010

Dairy and the New Food Pyramid

In yesterday's post I heaped scorn upon Dr. Mark Hyman, a doctor whose trip into alternative medicine has taken what I consider to be deadly detours.

However, he cited Dr. Walter C. Willett as someone against the supposed beneficial uses of dairy. Dr. Willett is as mainstream as medicine gets. He's the Chair of the Department of Nutrition and Fredrick John Stare Professor of Epidemiology and Nutrition at the Harvard School of Public Health. Moreover, he's led the most important large and long-term studies of health that pretty much anyone has done anywhere.

1. the 121,700-member Nurses' Health Study, initiated by Dr. Frank Speizer at the Channing Laboratory;

2. the Health Professionals Follow-up Study, a cohort of 52,000 men; and

3. the Nurses' Health Study II, a cohort of younger women numbering 116,000

When I kept railing at the small numbers and lack of meaning of studies on lactose intolerance found in the most exhaustive possible search of specific studies on lactose intolerance, milk, and calcium by the researchers presenting at the NIH state-of-the-science conference on Lactose Intolerance, I kept hoping they would cite some studies as major as the Nurses' Health Study. They never did.

The conclusions drawn from the Nurses' Study are opposed to all the conclusions drawn by the smaller, but more specific studies, done on dairy and calcium.

I found an article based on a Los Angeles Times article that is no longer online that summarizes Willett's understanding on the subject.
When Willett and his colleagues investigated the milk-drinking habits of 72,000 women in the Nurses' Health Study, they found that milk consumption was not associated with a lower risk of hip fracture, a measure of bone strength. In fact, women who drank milk twice a day were as likely to suffer a bone break as women who drank it once a week.

Likewise, the Health Professionals Follow-Up Study failed to find a relationship between calcium intake and bone fractures in more than 43,000 men. And a 2003 Swedish study of more than 60,000 women, which was published in the journal Bone, found no association between dietary calcium intake and fracture risk.

"We do need some calcium -- it's essential -- but the question is, how much?" says Willett, author of the 2001 book "Eat, Drink, and Be Healthy." He believes the body needs 500 to 700 milligrams of calcium daily rather than the 1,000 to 1,500 milligrams a day recommended by the dietary guidelines.

Why the difference?
Most clinical trials -- studies in which one group of people increases calcium intake and another group does not -- have shown that adding calcium to the diet increases bone density. But most clinical trials last for less than three years, says Diane Feskanich, an investigator for the Nurses' Health Study. "It could be that bone density does not continue to increase in the long run -- in fact, a study that went on for three years found that after an initial increase in bone density, it did not continue to increase in the third year."

Observational studies such as the Nurses' Health Study "are usually run over many years and in this way better suited to determine the long-term effects of high calcium intakes," Feskanich says.

Because of this, Willett was a long-time critic of the government Food Pyramid, and he wasn't afraid to say why the Pyramid was so bad.
There was not much receptivity in the 1990s, when we raised these criticisms of the food guide pyramid. It was almost an accepted religious belief that fat was bad and carbohydrates were good. Then there were lots of economic interests behind the food pyramid as well. Clearly the dairy industry is extremely well represented in the food pyramid. The beef industry is there, and it's very convenient that beef is combined along with fish and poultry and nuts and legumes. So each one of those industries can say: It's healthy to have three servings a day of our product.

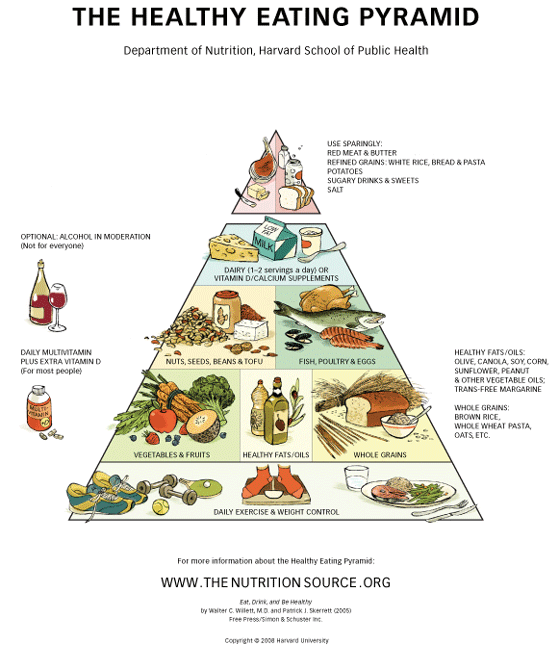
In fact, the Harvard School of Public Health drew up a complete alternate food pyramid to promote what they suggest should really be in a proper diet.


Here's the part that the Hymans of the world won't tell you. The Healthy Food Pyramid contains dairy. It has this to say.
Dairy (1 to 2 Servings Per Day) or Vitamin D/Calcium Supplements

Building bone and keeping it strong takes calcium, vitamin D, exercise, and a whole lot more. Dairy products have traditionally been Americans' main source of calcium and, through fortification, vitamin D. But most people need at least 1,000 IU of vitamin D per day, far more than the 100 IU supplied by a glass of fortified milk. (See the multivitamins section, below, for more information on vitamin D needs.) And there are other healthier ways to get calcium than from milk and cheese, which can contain a lot of saturated fat. Three glasses of whole milk, for example, contains as much saturated fat as 13 strips of cooked bacon. If you enjoy dairy foods, try to stick mainly with no-fat or low-fat products. If you don't like dairy products, taking a vitamin D and calcium supplement offers an easy and inexpensive way to meet your daily vitamin D and calcium needs.

That's not exactly in line with Willett's older pronouncements. The needs and the evidence has indeed changed over time.

And compare this:
Choose fat-free or low-fat milk, yogurt, and cheese. If you choose milk or yogurt that is not fat-free, or cheese that is not low-fat, the fat in the product counts as part of the discretionary calorie allowance.

If sweetened milk products are chosen (flavored milk, yogurt, drinkable yogurt, desserts), the added sugars also count as part of the discretionary calorie allowance.

For those who are lactose intolerant, lactose-free and lower-lactose products are available. These include hard cheeses and yogurt. Also, enzyme preparations can be added to milk to lower the lactose content. Calcium-fortified foods and beverages such as soy beverages or orange juice may provide calcium, but may not provide the other nutrients found in milk and milk products.

That sound awfully similar, doesn't it? Know where it comes from? From the new, revised government MyPyramid Food Pyramid.


Notice the difference between the two? The Harvard pyramid is incredibly complicated. The consuming public is not. In one of the posts on the conference I talked about the problem of comprehension a frightfully large percentage of the American population has with even the most basic food terms. The new Food Pyramid was drastically simplified because of this very problem. In fact, read how wonderfully easy-to-understand the new presentation is:
Six swaths of color sweep from the apex of MyPyramid to the base: orange for grains, green for vegetables, red for fruits, a teeny band of yellow for oils, blue for milk, and purple for meat and beans. Each stripe starts out as the same size, but they don't end that way at the base. The widths suggest how much food a person should choose from each group. A band of stairs running up the side of the Pyramid, with a little stick figure chugging up it, serves as a reminder of the importance of physical activity.

MyPyramid contains no text. According to the USDA, it was "designed to be simple," and details are at MyPyramid.gov.

That's taken directly off the Harvard Healthy Pyramid page.

I left off a few sentences, though.
Unless you've taken the time to become familiar with the Pyramid, though, you have no idea what it means. Relying on the Web site to provide key information—like what the color stripes stand for and what the best choices are in each food group—guarantees that the millions of Americans without access to a computer or the Internet will have trouble getting these essential facts.

The USDA also chose not to put recommended numbers of servings on the new Pyramid because these differ from individual to individual according to weight, gender, activity level and age. Instead, it offers personalized Pyramids at MyPyramid.gov.


That's a problem, although not a completely fair one. The government provides a wide variety of print materials, some targeted at Spanish-speaking audiences, mothers and mothers-to-be, and different ages. I'm sure America is awash in print explanations of the Pyramid.

The other legitimate objection is that MyPyramid is not accurate or give specifics. Notice that the Healthy Food Pyramid has a dozen parts.

That's the big issue. I face it every time I sit down at the keyboard and so does every other writer about health, diet, and nutrition. How much information to give? How much to simplify? What understanding can you assume your audience has? Will they get confused by too much detail or suffer if detail is slighted?

Harvard and the government came down on very different sides of this issue. I've given you both. Read them, download them, print out the posters. Decide for yourselves.

Bookmark and Share

Tuesday, March 23, 2010

Report from the LI Conference, part 14

For the next three posts, we'll be in Section 2 of NIH state-of-the-state presentations on Lactose Intolerance.

What are the health outcomes of dairy exclusion diets?

Consequences of Excluding Dairy, Milk Avoiders, Calcium Requirements in Children
Connie M. Weaver, Ph.D.
Distinct Professor and Head
College of Consumer and Family Sciences
Department of Foods and Nutrition
Purdue University

Although it is perfectly true that a totally adequate intake of nutrients can be achieved without consuming any dairy products, the reality is that Americans as a whole don't follow anything like that diet. They don't come close to getting sufficient nutrients even with dairy. The numbers are scary.

The role of milk products in meeting three nutrients for various age groups is illustrated in Table 1.


Most food guidance patterns recommend 3 cups of low-fat dairy products daily. The table contrasts the proportion of individuals meeting the dairy recommendations with those receiving less than one serving of dairy products as assessed from data from the 1999–2004 National Health and Nutrition Examination Survey (NHANES). The best and most economical source of the limiting nutrients is dairy. Supplements typically do not fill the gap of all these nutrients for those who do not consume recommended intakes of dairy products. Using NHANES 2001–2002 data, Gao et al. determined that it is impossible to meet calcium recommendations while meeting other nutrient recommendations with a dairy-free diet within the current U.S. dietary pattern. Using the 1999–2004 NHANES data, Nicklas et al. determined that < 3% of the U.S. population met potassium recommendations and 55% did not even meet their Estimated Average Requirements for magnesium.


Bone mass growth comes during adolescence, with 95% of adult peak occurring by age 16. Getting proper nutrients in childhood in critical. Dairy drinkers have a real advantage in driving those numbers up to and past the critical requirements. Here's a table of what the bone-related nutrient requirements are for those under 18.

Bookmark and Share

Sunday, March 14, 2010

Eatright.org

While we're taking a lunch break from the series of LI Conference posts, I'm going to catch up with some of the news about nutrition and products that I've been missing the past couple of weeks.

The American Dietetic Association (ADA) is an important source of good, solid information about dietary issues. They've updated their website, which can be found at www.eatright.org/Public/.

They put out a press release that touted the new features.

1. Diet reviews» This section looks at popular diets (South Beach, the 4-Day Diet, the Flat-Belly Diet, among others) and reviews them from a medical standpoint. A member of the ADA summarizes the diet's claims and strategies, lays out its nutritional pros and cons, and offers a bottom-line critique on whether it's a sound dietetic choice.

2. Question of the day» What is the shelf life of canned vegetables? Is lactose-intolerance the same as a milk allergy? Can pizza be healthy? A new query is posed and answered every one to two days, often with a link to other resources if you're looking for even more information.

3. Find a dietitian» Enter your ZIP code and specialty needs (e.g., celiac disease, weight control), and the site will provide a list of qualified dietitians and their contact information.

4. "Weigh In" blog» Registered dietitians blog about tackling a loved one's eating habits, helping kids navigate snack time, the earthquake in Haiti and other timely topics. The comment section - often the most fun part of blog reading - is sparse at this point, but that might improve as the site attracts more readers.

5. Disease management and prevention» It can be hard to get your general practitioner to discuss diet's role in various diseases, so this section - with information on autism, cancers, kidney disease and others - is a great place to turn for answers.

Bookmark and Share

Tuesday, February 09, 2010

FDA May Tackle Serving Sizes

Food companies think you're stupid. And they're right because they get away with lying to you legally.

I'm talking about what constitutes a serving size for the purpose of giving you information about calories, sugars, fat, and protein along with other nutrients. Serving sizes are supposed to be how much an average person would eat at one time. Hogwash. How many containers have you seen that you and everybody else in the world eats all of even though there are officially two and a half servings in it?

Why do companies do this? Because it makes calories seem so much smaller. It makes fats seem minimal. It makes sugar seem reasonable.

According to William Neuman of The New York Times

For ice cream, the serving size is half a cup. For packaged muffins, it is often half a muffin. For cookies it is generally one ounce, equal to two Double Stuf Oreos. For most children’s breakfast cereals, a serving is three-quarters of a cup.

It is difficult to say exactly how much people eat, said Lisa R. Young, an adjunct professor of nutrition at New York University, but she said that research showed that the portions Americans serve themselves had been growing in recent years.

When it comes to cereal, she said, many children probably eat two cups or more.

Parents who glance at a box of Frosted Flakes and see that it contains 110 calories per serving may not realize that their children may be getting several times that amount each morning at breakfast.

It isn't just Americans who haven't learned this lesson. An Australian group studied the subject and found that people routinely ate far more than a serving.
"We had breakfast in the boardroom, invited people to pour what they would normally have at that serve and we actually weighed it," she said.

"And while it's a small study it was interesting, because what we found was that on average, the men were pouring about 49 per cent more than the serving size recommended on the pack.

"Women were pouring 26 per cent more than the recommended serving size on the pack.

"So certainly if this information is going to be the basis for nutrition information then we need to get serve sizes right."

Official serving sizes are long overdue for revision, Neuman wrote.
Standard serving sizes were created by the F.D.A. in the early 1990s, partly to make it easier to compare the nutritional values of different products. Congress required that the serving sizes match what people actually ate. To determine that, the F.D.A. evaluated data from surveys of Americans’ eating habits taken in the 1970s and 1980s.

Some nutritionists say those surveys may be suspect, since people typically underestimate how much they eat. And there is general agreement that they are out of date.

The FDA says it's going to look at this issue. Good.
"If you put on a meaningful portion size, it would scare a lot of people," said Barry Popkin, a nutrition professor at the University of North Carolina. "They would see, 'I'm going to get 300 calories from that, or 500 calories.'"
We need to be scared. Labels are lying to us. It has to stop.

Bookmark and Share

Tuesday, January 19, 2010

Food Pyramids From Around the World

Here's a cool question from the Victoria Advocate.

I recently traveled to Canada and noticed their food pyramid was actually a rainbow. Since you have traveled abroad so much, I was wondering if you know the shapes of other countries pyramids? Also, do you agree with the U.S. food pyramid?


Phylis B. Canion responded:
Israel uses a chalice. Japan arranges their food in the number six to represent the six food groups. Portugal, Germany, Norway and the United Kingdom put their food guides in the shape of a circle. Denmark uses a compass. Hungary uses a house. Mexico uses a plate. China and Korea use a pagoda. Thailand uses an inverted pyramid and the Philippines uses a star. South Africa's food graphic contains the least number of food groups and organizes food in a unique way - according to the food's function in the body.

Group One contains energy foods like maize and grains, Group Two contains body building foods including chicken and beans, and Group Three contains protective foods like fruits and vegetables.

South America does not use a food pyramid. Most other countries have adopted the United States version.

Bookmark and Share

Wednesday, September 23, 2009

Free-From Foods Not Free From Salt

Food is great stuff. It's delicious in a thousand different ways, but mostly because humans have adapted over hundreds of thousands of years to the components of foods. This works in two different ways. First, there are the distinct sensations conveyed by our "taste buds." Sweet, sour, salty and bitter, and possibly a fifth sometimes called umami or savory. We're particularly prone to find sweet and salty foods delectable but are likely to be repelled by bitter and sour tastes. Children find the latter especially yucky and this may guide them to sweet and salty foods which they retain a preference for as adults.

We're also adapted to like the taste of fats even more than other components of food, presumably because fats pack more than twice the caloric density of proteins or carbohydrates and that could mean survival in the wild.

Most inhabitants of western countries today find it more than easy to get all the fats they need today just as it's easy to find the once rare and precious sweetener we know as sugar. Most nutritionists will argue that we eat way too much fat and sugar. And salt, for that matter.

So for years food scientists have slaved over their test tubes and test kitchens trying to create food that is fat-free or sugar-free or salt-free or all three that tastes just as good as the originals. Most of the time they fail. "Free from" food as it's sometimes called, more usually in the U.K., has a distressing propensity to taste like cardboard. So the scientists cheat. They'll sometimes load up fat-free foods with sugars just to give our palates something to play with on the way down, for example. Nutritionists tend to go into palpitations at such antics, and for good reason.

Now comes the distressing news that a study of house brands at five British supermarket chains finds them loading up the free from dairy-free or wheat-free foods with tons of extra salt. Salt has the property of enhancing flavor, which is why a pinch - or more - of salt is added to about everything. But this BBC News article reported that the chains go a lot farther than that.

Sainsbury's Free From Jaffa Cakes have 0.67g of salt per 100g, compared with 0.1g of salt per 100g in standard Sainsbury's Jaffa Cakes.

This is more than six times the salt level of the standard version.

Morrison's standard Chocolate Chip Cookies contain 0.5g of salt per 100g, while their Free From version contains 1.5g per 100g - three times as much.

ASDA Free From Double Chocolate Muffins have over three times as much salt as ASDA Double Chocolate Muffins, 1g per 100g as opposed to 0.3g per 100g.

Tesco's Free From Victoria Sponge has more than double the amount of salt as its standard cousin, 1.4g per 100g compared with 0.6g of salt per 100g.

Do free from products need to have this extra salt to taste good? Not necessarily. Each supermarket has some product equivalents with lower salt.

While the impact of salt on health has been hotly disputed of late, "free from" foods should be approximately equivalent to their regular counterparts and there's no good reason to load them up with salt.

Does this mean that I'm recommending yet more ingredients list reading in the supermarket? I'm afraid so. Don't get so happy at finding a dairy-free product that you toss it unthinkingly into your grocery cart. (OK, you can do it once.) Check closely how those canny food scientists are achieving the feat. Dairy-free should never mean unhealthy.

Bookmark and Share

Tuesday, August 04, 2009

Nestle Boost Kids Essentials. Lactose-Free, But...


Nestle, the worldwide food giant, launched Boost Kids Essentials Nutritionally Complete Drink earlier this year with a mightily barrage of claims, such as in this press release.

Today, parents have a new way of providing their children with optimal nutrition and protective benefits with the launch of BOOST(R) Kid Essentials Nutritionally Complete Drink. BOOST Kid Essentials Drink--an innovative product developed by Nestle HealthCare Nutrition--is the only nutritionally complete drink that gives kids ages 1 through 13 the power of immune-strengthening probiotics plus complete, balanced nutrition. Probiotics, delivered through the BOOST Kid Essentials straw, have been clinically shown to help strengthen the immune system to help keep kids healthy(1,2). In addition, BOOST Kid Essentials Drink fortifies a child's diet with 25 essential vitamins and minerals, seven grams of muscle-building protein, key antioxidants and 244 energy-packed calories. ...

Probiotics are live, active cultures that--when consumed in adequate amounts--provide several health benefits, including aiding digestion and supporting a healthy immune system. Together, the power of immune-strengthening probiotics plus complete, balanced nutrition gives parents a delicious option to help keep their children strong and healthy. ...

BOOST Kid Essentials Drink is also digestion-friendly, being lactose free and gluten free, and does not contain high-fructose corn syrup.

Whenever I see a drink that labels itself as lactose-free, I wonder what it does contain.

The Boost main webpage will tell you, although you have to click on the Healthcare Professionals tab to see the answer. What do you get there? The nutritional labeling information that will be on the side of every box. Really? They're saying that the minimal information demanded by law is something parents needn't know or wouldn't be interested in?

As you would expect, the ingredients are technically lactose-free. No multinational conglomerate's lawyers would let them post a false claim that blatant. But parents may not be as reassured by the actual ingredients as by the press release's glowing message.

Here are the ingredients for the chocolate flavor:
WATER, SODIUM CASEINATE (MILK), HIGH OLEIC SUNFLOWER OIL, SOYBEAN OIL, COCOA PROCESSED WITH ALKALI, MEDIUM CHAIN TRIGLYCERIDES, WHEY PROTEIN CONCENTRATE, CALCIUM CASEINATE AND LESS THAN 0.5% OF CALCIUM PHOSPHATE TRIBASIC, CELLULOSE GEL, POTASSIUM CITRATE, SOY LECITHIN, MAGNESIUM PHOSPHATE TRIBASIC, CHOLINE CHLORIDE, NATURAL AND ARTIFICIAL FLAVOR, SODIUM CHLORIDE, CARRAGEENAN, ASCORBIC ACID, CELLULOSE GUM, TAURINE, M-INOSITOL, ALPHA TOCOPERYL ACETATE, FERROUS SULFATE, ZINC SULFATE, NIACINAMIDE, L-CARNITINE, CALCIUM PANTOTHENATE, VITAMIN B6 HYDROCHLORIDE, THIAMINE HYDROCHLORIDE, COPPER GLUCONATE, MANGANESE SULFATE, RIBOFLAVIN, BHA/BHT (TO PRESERVE FRESHNESS), VITAMIN A PALMITATE, BETA CAROTENE, FOLIC ACID, BIOTIN, CHROMIUM CHLORIDE, POTASSIUM IODIDE, SODIUM MOLYBDATE, SODIUM SELENITE, VITAMIN K1, VITAMIN D3, VITAMIN B12.

Chemicals! Run for your lives!

Nestle can't sell you milk at a much higher price when you already have milk in your fridge. They have to give you extra value, something that you will like and so will your kids.

Like sugar. A boost has 33 grams of carbohydrates in a container (1 and 1/32 cup). A cup of chocolate milk has 26 grams. That's 27% more sugar. And containers. The kids can take the pre-made containers with them as they run around from all that sugar and that's, okay, that's convenient if lousy environmentally. And you get all those essential vitamins and minerals, as if every other kids' food in modern America isn't already fortified with essential vitamins and minerals. What kids don't get enough of is calcium, but Boost's calcium content is slightly more than chocolate milk and slightly less than regular milks.

I could go on, but you're still waiting for the lactose part. Especially with all those terms that sound like milk. Sodium caseinate, a salt that is derived from milk protein. Calcium caseinate, ditto. And whey protein concentrate. Until recently, every food made with whey protein concentrate contained lactose. A new process, one that I wrote about earlier this year, changed that, making whey protein concentrate the go-to ingredient for making foods more milk-like without lactose.

Boost Kids Essentials is high-priced fortified flavored sugared artificial milk, with probiotics. You have to judge whether it's something for your kids. Don't go anywhere near it if you're milk allergic, though. And it's not for galactosemics, either. You're a parent. Nutritional information is something you should read and doublecheck. Don't let it be hidden away from you.

Bookmark and Share

Friday, July 17, 2009

Cream vs. Milk: The Battle of Carbs

Here's an email I received with confusion whose source I never could quite figure out.

I'm a diabetic, so I really limit the carbs I consume in a day. That's how I stay off meds. I see that milk has quite a lot of carbs I suppose due to the lactose. But cream does not have a significant amount of carbs. So thats what I stick with. Why !! does cream not have carbs or lactose?? Is there some process that takes place in manufacturing the product that takes it out?? I really curious about this. I have found a half&half product that claims to have taken the fat out. So that's what I use. It claims to have very low carbs.


Milk, like most foods, really, is water plus small amounts of carbohydrates, fats, and proteins.

The carbohydrates in milk are all from the sugar, which is lactose. This is true for all forms of liquid milk, from skim milk to heavy cream. The only major difference is the amount of fat they contain. The lactose - carbohydrate - content is similar.

Whole milk 4.8%
Half-and-half 4.2%
Cream 3.9%

[The numbers are taken from my own Lactose Percentages page in my Lactose Intolerance Clearinghouse.]

Not surprisingly, half-and-half - half milk and half cream - has a lactose content about halfway in between.

The difference between them in an ounce, which is about a splash of cream in coffee, would be about 1/4 of a gram. That's a really tiny amount.

Now, about the low fat half and half. That sounds oxymoronic, but such substitutes really exist, both in low fat and fat-free varieties. Here's an ingredients list for one such:
Nonfat milk, milk, corn syrup solids, artificial color, sugar, dipotassium phosphate, sodium citrate, mono and diglycerides, carageenan, natural and artificial flavors, vitamin A palmitate.

It's just fat-free milk bulked up with sugar - corn syrup solids, which means it may be lower fat, but would be higher in carbohydrates, not lower.

And this site has a direct nutritional comparison.
Half And Half (Land O Lakes)
Serving Size: 2Tbsp (30mL); Calories: 25, Total Fat: 1.5g, Carbs: 1g, Protein: 1g

Fat Free Half and Half (Land O Lakes)
Serving Size: 2 Tbsp; Calories: 20, Total Fat: 0g, Carbs: 3g, Protein: 1g

Just as I said. The amount of carbs increase in the fat free variety. You need to balance off the solids so that the fluid doesn't taste too watery. The half and half has 3.5 grams of solids; the fat free version has 4 grams of solids, just distributed differently.

Switching fat and sugar for all sugar isn't much of a bargain for anybody, and particularly not for a diabetic.

Always read the nutritional information given. It will save you in the end.

Bookmark and Share